The Question
Markets rarely feel expensive while they are rising. Liquidity is abundant, narratives are strong, earnings expectations look robust, and capital continues to flow into equities. In such an environment, valuations tend to expand quietly in the background. This raises a simple but important question: are investors buying genuine growth, or are they paying today for returns that would normally arrive tomorrow?
One way to approach this question is by looking at the relationship between valuation and future returns. If valuation contains information about long-term performance, then periods of expensive markets should systematically lead to lower returns later. This is precisely what the CAPE ratio attempts to capture.
What CAPE Actually Measures?
The Cyclically Adjusted Price-to-Earnings (CAPE) Ratio or Shiller’s PE Ratio measures the price of the market relative to the inflation-adjusted average earnings over the past 10 years.
The purpose of using a ten-year average is to smoothen out the business cycle. Corporate earnings tend to fluctuate sharply during expansions and recessions, and relying on a single year of earnings can give a misleading impression of valuation. By averaging a decade of real earnings, CAPE provides a more stable measure of how expensive the market is relative to its long-term earning power.
A high CAPE ratio indicates that investors are likely paying more for each unit of long-term earnings, while a low CAPE ratio suggests that equities are relatively inexpensive compared to their historical earning capacity.
Where India Stands Today?
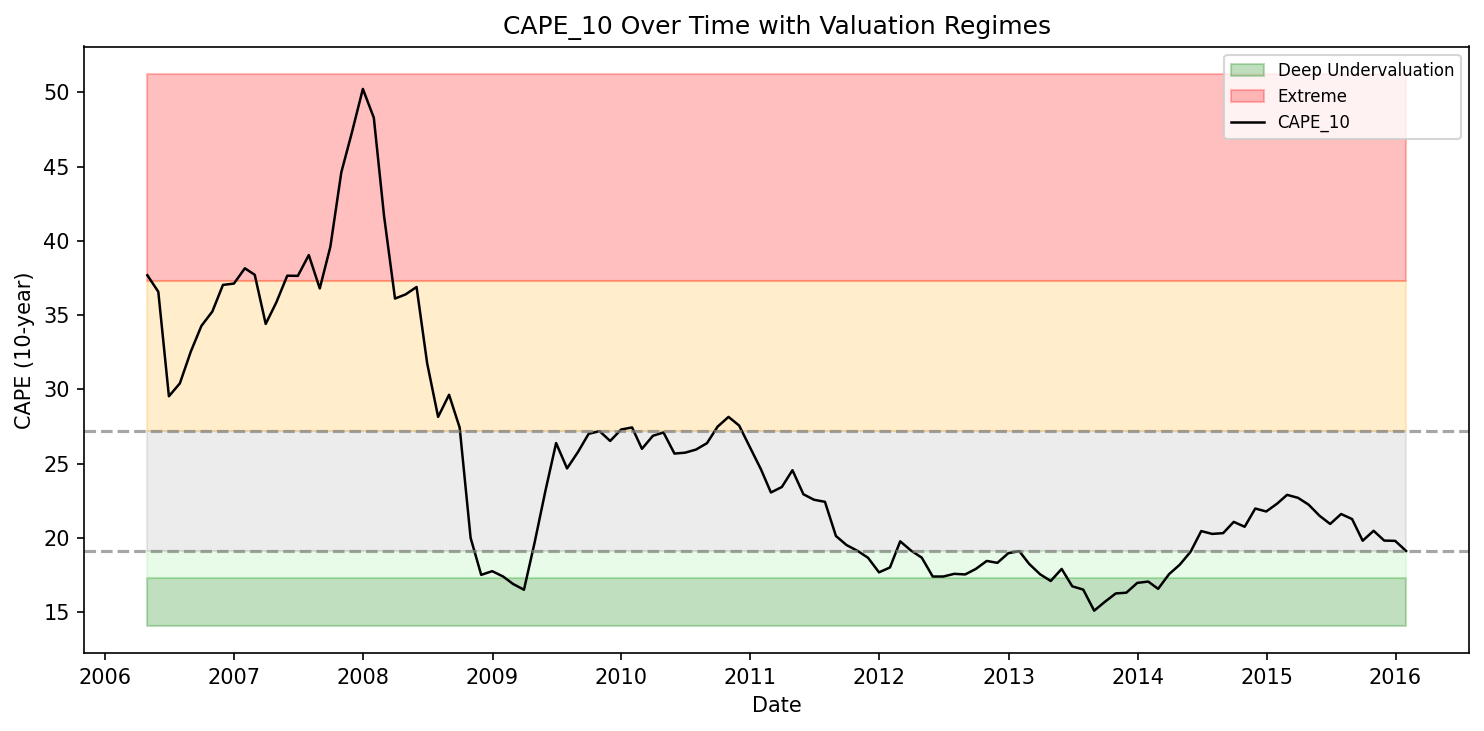
As of January 2016, the CAPE ratio stood at roughly 19.1, the latest point in the dataset for which full forward return data is available. In historical terms, this places the market around the 28th percentile of its valuation range. Put simply, valuations were lower than many periods in the past, though not at the deeply discounted levels typically seen during market stress.
Indian equity valuations have historically moved through clear cycles. Periods of economic uncertainty, liquidity tightening, or macro stress have often pushed CAPE into the lower end of its range. Conversely, phases of strong liquidity, optimistic growth expectations, or powerful market narratives have tended to push valuations toward the upper extremes.
The reading in early 2016 therefore sits somewhere in between these extremes. The market was not euphorically expensive, but it was not deeply cheap either, positioned closer to the lower side of its historical valuation range.
The chart below captures how valuations change across market cycles. Markets tend to look cheap when conditions are difficult and investors are cautious, and expensive when liquidity is abundant and optimism drives strong rallies.
When Markets Get Pricey, What Happens Next?
One of the main reasons investors pay attention to the CAPE ratio is that it has historically shown a strong relationship with long-term market returns. In simple terms, the price investors pay for earnings today often influences the returns they earn in the future. Markets that start from lower valuations tend to deliver stronger returns, while markets that begin from higher valuations often produce weaker outcomes.
The chart below illustrates this relationship by dividing historical valuations into five groups, from Q1 (the cheapest periods) to Q5 (the most expensive periods) based on CAPE levels.
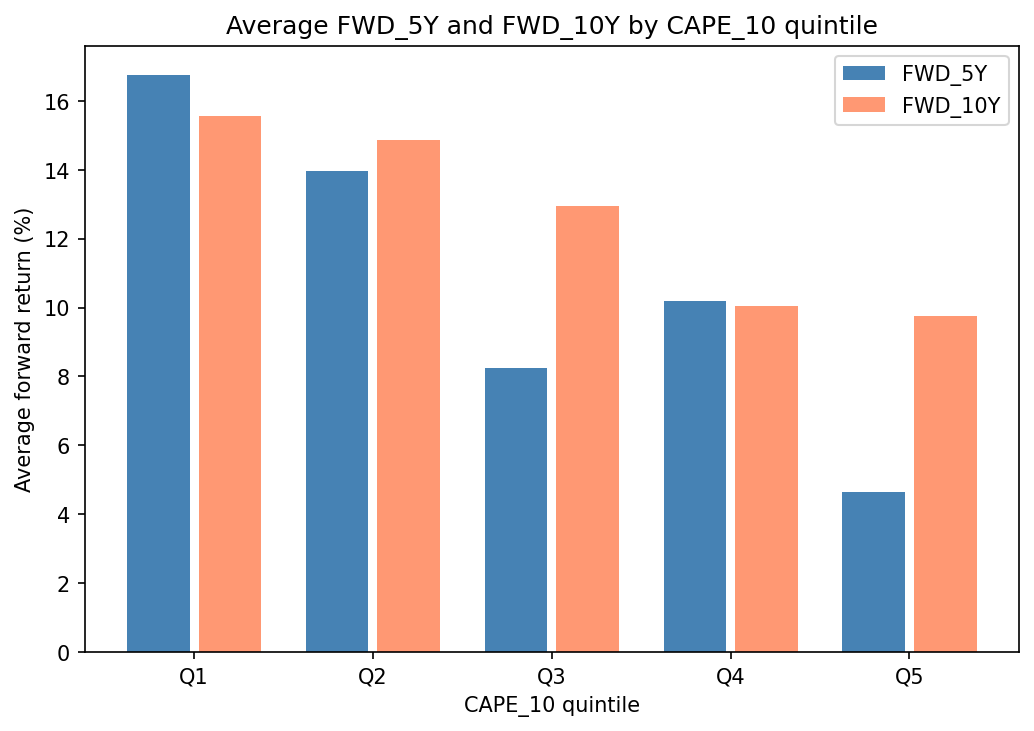
A clear pattern emerges. When the market was in its cheapest valuation range (Q1), it generated the strongest forward returns, averaging roughly 16–17% over the next five years and around 15–16% over the following decade. As valuations move higher across the quintiles, these forward returns gradually decline.
At the other end of the spectrum, when the market was in its most expensive valuation range (Q5), forward returns were significantly lower around 4–5% over the next five years and roughly 10% over ten years.
The takeaway is that starting valuations matter. When investors enter the market at relatively lower valuations, long-term outcomes have historically been much stronger than when markets are already priced at elevated levels.
The difference is significant. On average, the gap in 10Y returns between the cheapest and most expensive market environments has been close to 6% per year. Over long periods, a difference like this can compound into a very large gap in total wealth.
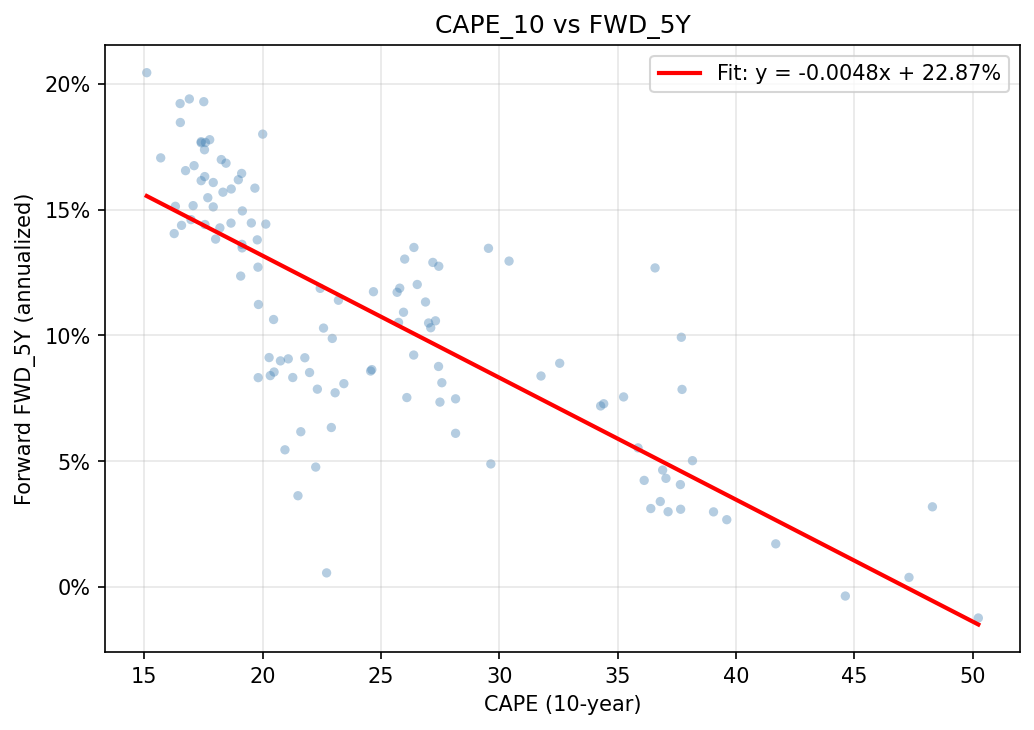
To test whether valuation represents good quality information about future returns, we also examine the relationship between CAPE and forward 5-year returns.
The regression line clearly slopes downward, indicating that higher starting valuations tend to correspond with lower future returns.
The relationship becomes even clearer when we extend the horizon to 10 years.
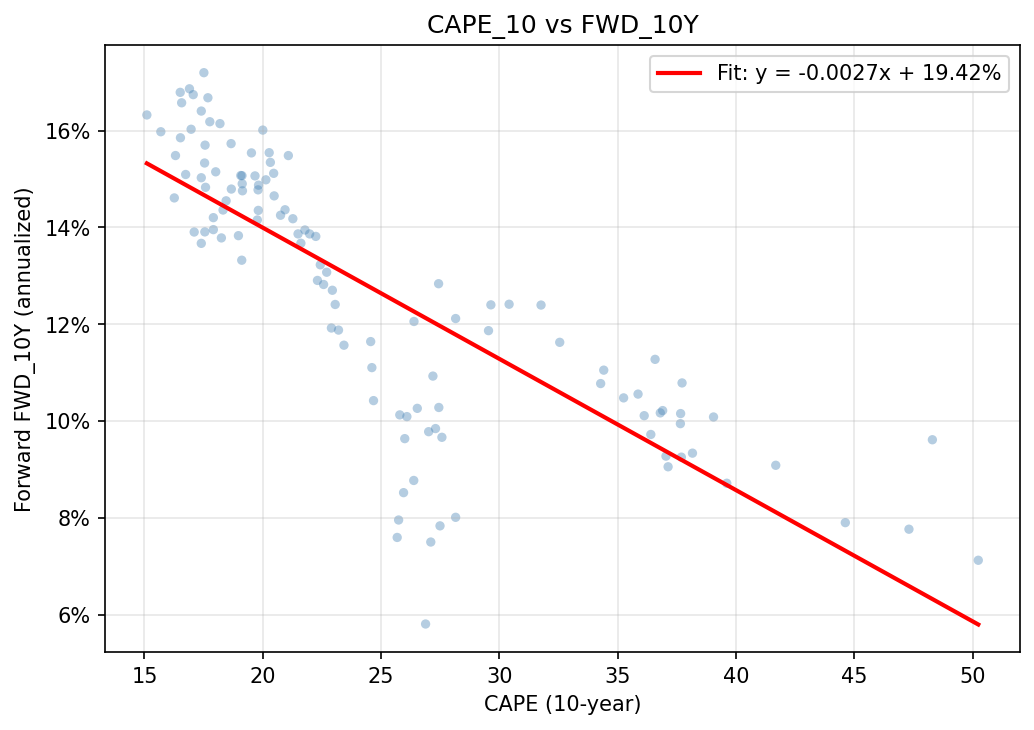
This indicates that valuation plays an even stronger role in anchoring long-term returns, while shorter horizons remain more influenced by macro shocks and market cycles.
How Valuable is Valuation?
When markets trade at unusually high valuations, the instinct is often to assume that prices have simply run too far ahead of fundamentals, but the other big factor is how much money is floating around in the system and how easily it can reach the stock market.
When the RBI lowers interest rates, saving money in banks or bonds starts giving poor returns, so people naturally look for better options and often end up putting more money into equities. The more money that flows into the market, the higher stock prices tend to go. This is why stock markets usually do well when borrowing is cheap and money is easy to access, and tend to struggle when those conditions reverse.
In India, something deeper has also been happening over the past decade: families have been gradually moving their savings out of gold, real estate, and fixed deposits and into mutual funds, SIPs, and similar financial products, which means there is now a steady stream of domestic money flowing into the stock market on a regular basis.
Now, when stock prices look unusually high, the natural reaction is to assume they have gone too far and are due for a fall, but that is not always the case. Prices can stay high for genuine reasons, sometimes because there is simply a lot of money chasing limited stocks, and sometimes because investors believe that companies will earn significantly more in the future due to big changes like new technology, government reforms, or long-term population trends such as the current wave of enthusiasm around artificial intelligence.
The most extended periods of high valuations tend to happen when all of these factors come together at once, that is easy money, strong growth expectations, and a widely believed story about the future, each feeding into the other and keeping prices elevated far longer than one might expect. That said, these conditions do not last forever, and when the assumptions behind them start to crack, prices can come down just as meaningfully as they went up.