What I initially set out to write was how the Repo Rate changes affect the markets, but what I finally fixated on while researching more about it was much more insightful and noteworthy. In this edition, we set out to understand how the money flows in the Indian economy and how beautifully fixed income instruments react to accommodate both the major macroeconomic events along with the Monetary Policy Decisions underway.
Setting the Stage
The objective is to understand the interdependence between the proxies of borrowing and lending of money. For this one, we use the Repo Rate, the 91-Day Treasury Bill Cut-off Yield, and the 10 Year Government Security Yield.
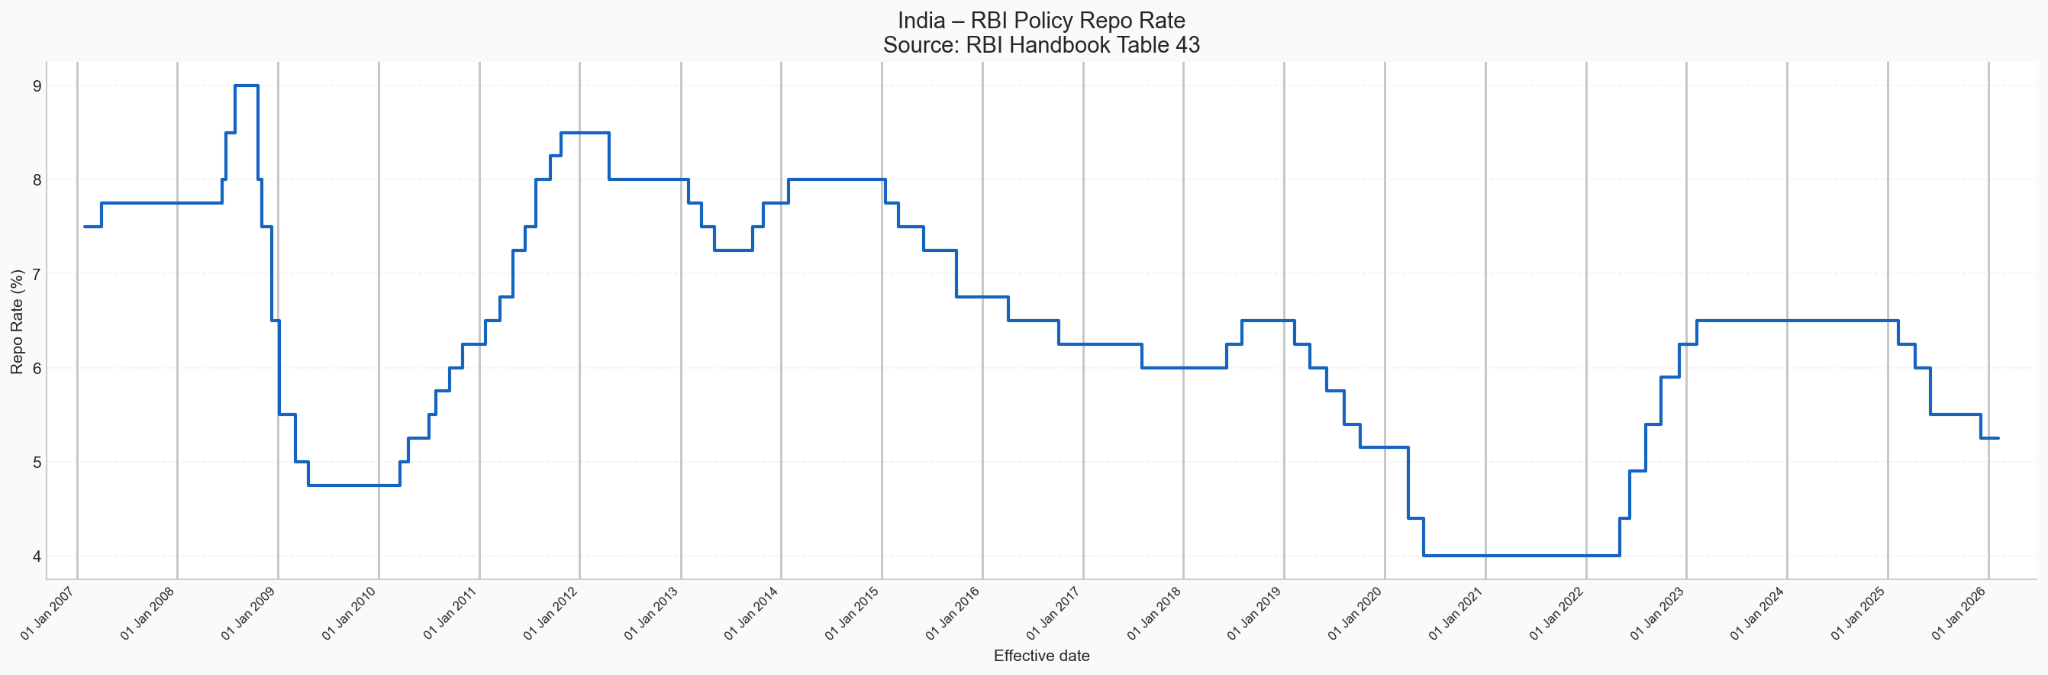
On paper, the repo rate is simply the interest rate at which the RBI lends money to the banks for an overnight period against the collateral of government securities. In practice, it is the price of money in India. And when the price of money changes, everything else adjusts to accommodate this shift.
But one might question that, why do banks borrow from the RBI? Because banks are required to maintain a percentage of their net demand and time liabilities (NDTL) as idle cash with the RBI, and as of early 2026, this number is 3% of the net deposits. As household deposits with the banks keep rising, this amount also keeps rising.
The 91-Day T-Bill is a short term government security that the government issues to borrow money from the public, and the cut-off yield for the same is the highest accepted interest rate determined at the end of the market auction conducted by the RBI. This is essentially the rate at which the government is borrowing for the short term.
Moving on, the 10Y G-Sec yield is the annual return (interest rate) that investors demand to lend money to the Government of India for 10 years by buying its benchmark government bond. It represents the long-term borrowing cost of the Government of India. It is often called the benchmark rate for the entire economy.
The Interplay
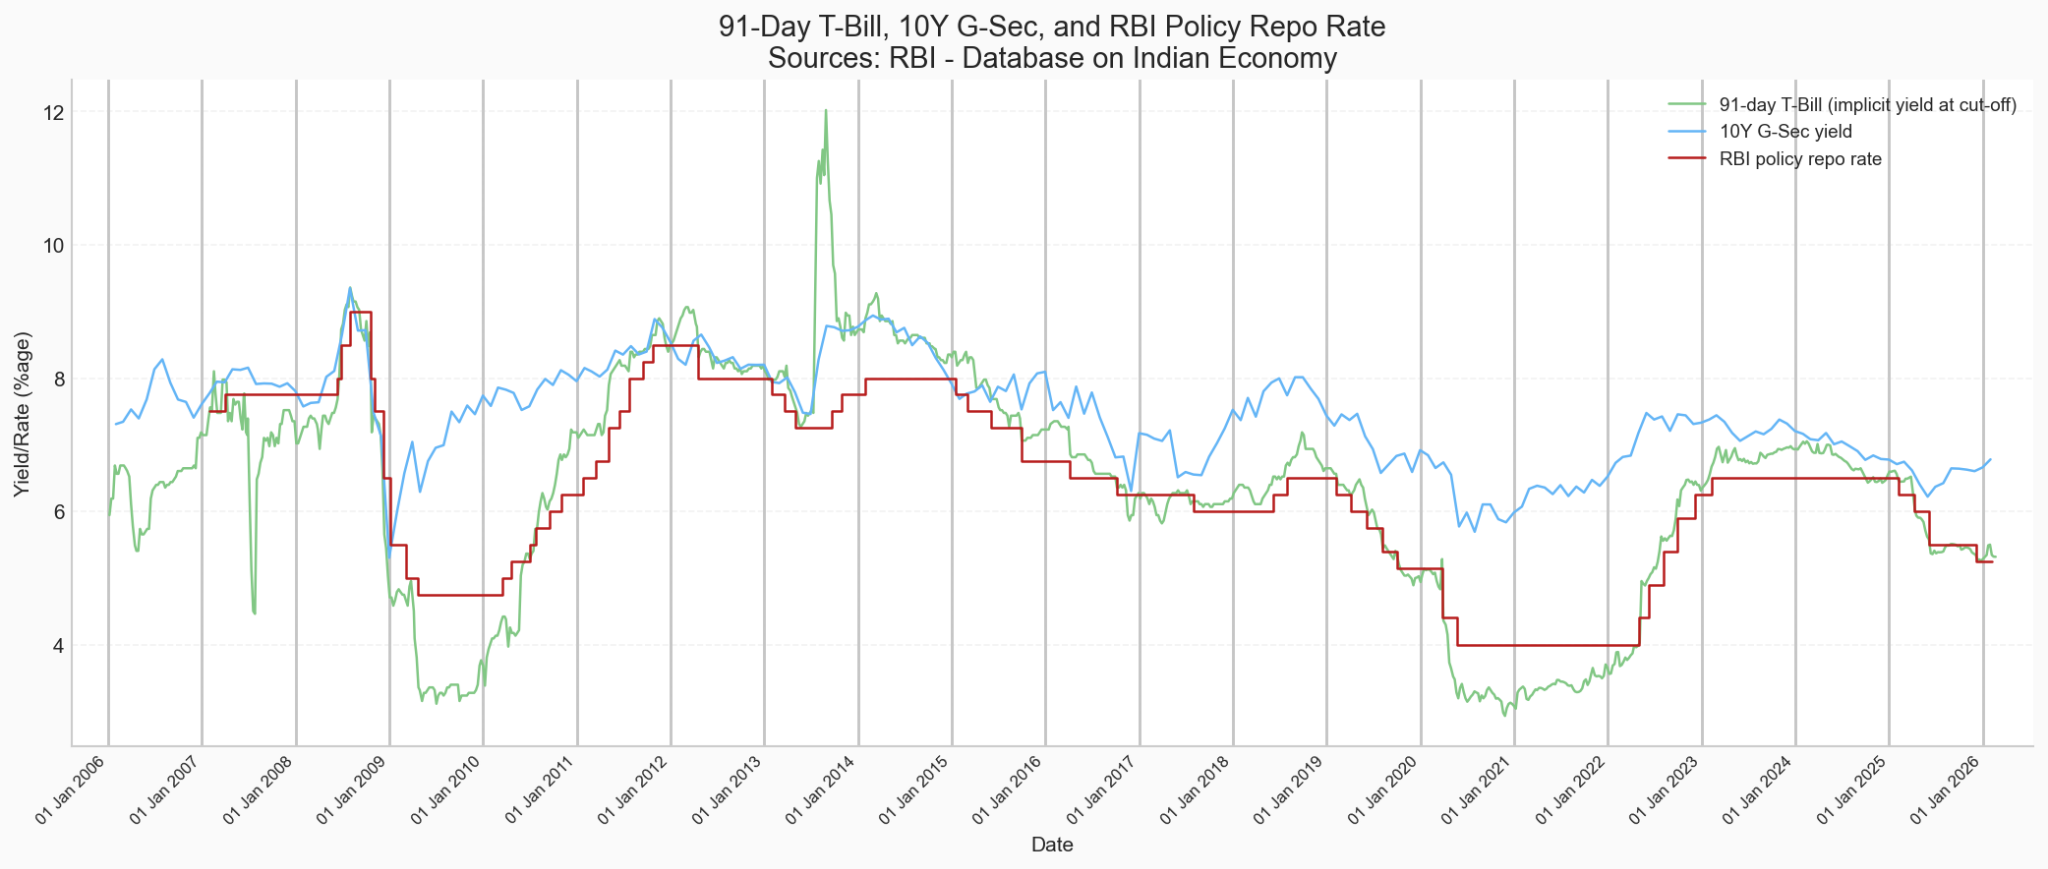
This line plot reinforces the theoretical idea that the short term borrowing rate (the 91-Day T-Bill Yield) reacts almost instantly to all the repo rate decisions taken by the Monetary Policy Committee.
The 10Y G-Sec yield, even though following almost a similar trend, reacts slowly because it also prices in expected future repo rates, inflation expectations, fiscal deficit, global yields (especially US), liquidity conditions etc. So, if the rate hike/cut was already expected, the 10Y G-Sec yield may rarely move, and vice versa.
Mental Model to Build Intuition
I started out with this fundamental question:
If the bank's cost of borrowing (the repo rate) is rising, why will it lend (buy government securities) at a lower rate ever? So ideally, the repo rate should always be less than the yield, right?
Here are the caveats to this question:
- Banks do not fund all their assets at the repo, they have a lot of other sources (like CASA, term deposits etc.) and repo rate for them is a short term liquidity adjustment measure.
- Banks sometimes park their excess funds in government securities (whose yields could be less than the repo rate) because it is better to get a small risk-free rate of interest than to let the cash sit idle.
- Banks must maintain Statutory Liquidity Ratio (SLR) holdings in government securities, and T-bills qualify. So sometimes banks buy them even at lower yields to meet compliance.
- If banks expect that the repo rate will be cut soon, then, buying a 6.30% T-bill before repo falls to 6.00% becomes profitable. Bond yields move on expectations, not just current repo.
Brewed Up Insights
- 2007-09: In the timeframe before the crash, there was an insane surplus of liquidity in the markets and then what followed was a structured tightening. During this time, the short term yield dropped massively while the repo rate was kept constant. This was just in time with the 2008 financial crisis.
- 2009-11: Following a dip in 2007-2009, the Reserve Bank of India saw its foreign reserves rise to over $310 billion by June 2011, driven by capital inflows and economic recovery. The cost of short term borrowing for the government was again at an all time low. But, during this time, the long term yields were rising, which suggested that the bond market did not believe easing is sustainable. Which was very much held true when the rates were hiked in 2012.
- 2013-14: The infamous Taper Tantrum is clearly discernible from the graph when the short term yields were at an all-time high. The Taper Tantrum was a 2013 market shock triggered when the US Federal Reserve signaled it would slow its bond-buying under quantitative easing. Investors feared tighter global liquidity, causing US bond yields to spike and capital to rush out of emerging markets. India saw currency depreciation, rising bond yields, and stock market volatility.
- 2020-22: When the COVID-19 pandemic hit, both the short term yield and repo rates again tested and breached their 2009 lows. The repo rate was cut aggressively and the 91-Day T-Bill yield followed the downward trend, injecting the markets with excessive liquidity. The long term borrowing did not collapse with the repo rate because of the huge fiscal deficit, supply of bonds increased sharply, inflation risks lingered, and global yields moved around.
- Late 2025 onwards: The 91 Day T-Bill yield has been moving in high correlation with the repo rate, but the 10 year G-Sec yield has been moving in opposite direction. This is called Bull Flattening. The bond markets are saying that the tightening will not last long. The market thinks that hikes are near, a growth slowdown is expected, inflation is expected to fall, and future rate cuts may be anticipated.
How Does It Affect the Equity Markets?
For a retail equity investor, this interplay determines long term portfolio outcomes. When the repo rate and short-term yields fall, liquidity expands, risk appetite improves, and equity valuations tend to stretch thinner, especially in mid-caps, small-caps, and high-growth stocks.
When tightening begins and short-term yields rise sharply, liquidity becomes selective, valuations compress, and the market starts rewarding balance-sheet strength over aggressive expansion. The 10-year G-Sec yield matters even more subtly. It acts as the economy's discount rate. If long-term yields rise, future corporate earnings are valued less generously, if they fall, growth stories regain premium valuations.
A flattening yield curve, like the one visible recently, often signals that markets expect slower growth ahead, which historically favors large caps and defensives over leveraged cyclicals. Tracking the bond market is not about predicting daily stock moves, it is about understanding the liquidity backdrop that ultimately determines how much investors are willing to pay for earnings.