of America's leading economic index is linked to manufacturing
The Fed raised rates, then America's leading index slipped
The Conference Board's Leading Economic Index (LEI) is a single number made up of 10 different pieces of US economic data. These are indicators that usually change before the broader economy does. The index is released every month and is designed to spot a possible turning point in the economy about 7 months in advance. So when people say an indicator is warning about a possible US recession, they are often talking about this one.
On September 16, the Fed raised interest rates by 0.25 percentage points to 3.75-4%. This was the first rate hike since July 2023. The Fed said the economy was expanding at a solid pace. 2 days later, the Leading Economic Index fell again. The Conference Board said the US economy was facing a less certain environment ahead.
So how can the Fed say the economy is solid while the index says things are slowing? The Fed expects the US economy to grow 2.3% this year and 2.4% next year. That is higher than the 2% growth rate the Fed thinks the economy can manage over the long run. But growth has already slowed sharply. The economy was growing at a 4.4% annual pace in July-September 2025. By April-June 2026, growth had slowed to 1.5%.
The answer is partly in what the Leading Economic Index is actually made of. Factory working hours make up 27.8% of the index. A survey of factory orders makes up another 16.5%, while 2 other measures of orders make up 11.7%. Together, that means 56% of the index is linked to manufacturing. But manufacturing itself is only 9.4% of the US economy. Expectations about the economy make up another 15.5% and were the biggest drag on the index in August.
Then there is another interesting part. 10.7% of the index is based on the yield spread between the 10-year Treasury yield and the Fed funds rate. On September 17, the 10-year Treasury yield was 4.94%, while the Fed funds rate was 3.875%. When the Fed raises the Fed funds rate, this yield spread gets smaller, which pulls the Leading Economic Index down.
At the same time, the Fed is watching something the index does not capture as directly: prices. Consumer prices were 3.4% higher in August than a year earlier, while energy prices were up 16.3%. For the Fed, expensive energy means higher inflation. For households, it means higher costs and less money left to spend. The same expensive energy is therefore showing up differently in the two measures.
There is also an important warning. The Leading Economic Index predicted a recession in 2022, but that recession never happened.
LEI is useful for spotting when the economy is slowing, but it is much less reliable at saying that a recession is definitely coming. And this month, part of its weakness is simply because the Fed raised rates, which directly affects one of the components of the index.
More than half of America's leading index is factories
10 things go into the Conference Board's leading index, and they do not count equally. 4 of them measure factories, and together they carry 56%.
SHARE OF THE INDEX
- Factories56.0%
- What people expect15.5%
- Money and markets11.8%
- The Fed's own rate gap10.7%
- Jobs and housing6.1%
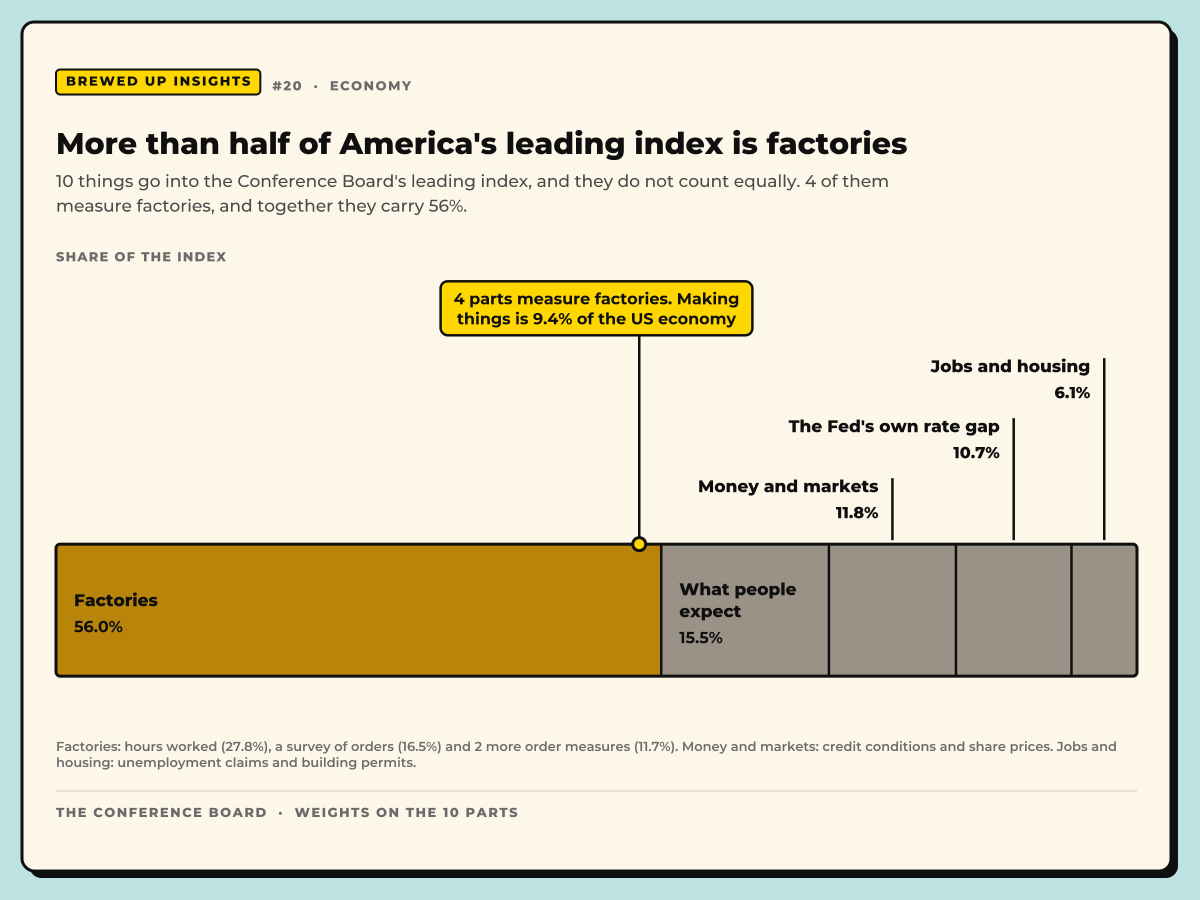
4 parts measure factories. Making things is 9.4% of the US economy
Factories: hours worked (27.8%), a survey of orders (16.5%) and 2 more order measures (11.7%). Money and markets: credit conditions and share prices. Jobs and housing: unemployment claims and building permits.
The Conference Board · Weights on the 10 parts
Sources
- Federal Reserve, FOMC statement, 16 September 2026 (target range raised a quarter point to 3-3/4 to 4 percent, 12-0, "economic activity is expanding at a solid pace", "inflation remains elevated")
- Federal Reserve, Summary of Economic Projections, 16 September 2026 (median real GDP 2.3% in 2026 and 2.4% in 2027 against a 2.0% longer-run rate; 16 of 18 dots above the new midpoint for end-2026)
- The Conference Board, US Leading Economic Index press release, 18 September 2026 (August 2026: LEI 99.5, -0.1%, diffusion above 50 and no recession signal, 2027 forecast cut to 1.8%)
- The Conference Board, Description of Components: the weights on the 10 parts of the leading index
- BLS, Consumer Price Index, August 2026 (all items 3.4% over 12 months, energy 16.3%, petrol over a third of the monthly rise)
- FRED, Federal Funds Target Range Upper Limit (Board of Governors): last increase 27 July 2023, then cuts through 2024 and 2025
- FRED, 10-Year Treasury Constant Maturity Rate: 4.94% on 17 September 2026
- FRED, Value Added by Industry: Manufacturing as a Percentage of GDP (BEA): 9.4% in Q1 2026
- BEA 26-38, GDP (Second Estimate), 2nd Quarter 2026, 26 August 2026 (real GDP +1.5% annualised, +2.1% in Q1)
- BEA 26-04, Gross Domestic Product, 3rd Quarter 2025 updated estimate, 22 January 2026 (+4.4% annualised)
- The Conference Board, US LEI press release, 20 February 2024 ("the leading index currently does not signal recession ahead")
- The Conference Board, US LEI press release, 18 August 2022 (July 2022 data): "could tip into a short but mild recession by the end of the year or early 2023"