services sub-sectors that grew in July 2026 on a year earlier
India can now track services every month
India has had a monthly measure for factories for years: the Index of Industrial Production, or IIP. Since July 2026, it has one for services too: MoSPI’s Index of Services Production, or ISP.
The idea is old, but the index is new. MoSPI first set up a committee to build one in 2004. It could agree a method for only 7 sub-sectors, because the data was not there. GST returns changed that, and a new committee started work in May 2025. The first reading, for April 2026, came out on 14 July 2026, and the latest, for July 2026, on 29 September. So there are just 4 monthly readings so far.
The ISP tracks how much the services economy produces each month, after removing the effect of price changes. It covers 19 parts of the economy, from shops and transport to banks, telecom and IT. Together, they cover about 60% of services, but only the formal economy.
Most of the data comes from GST returns. Railways, airlines, banks and insurers use their own official data. The index uses 2024-25 as its base year, and a new reading comes out on the 29th of every month, roughly 2 months after the month being measured.
Trade makes up 23.6% of the index, while IT and computer services make up another 22.5%. Together, they account for almost half of the index.
In July 2026, 17 of the 19 sectors grew from a year earlier, with 10 growing by 10% or more.
Administrative and support services grew the most at 20.9%, followed by retail trade at 18.5% and real estate at 14.4%.
Only 2 sectors shrank: air transport, down 8.4%, and repair services, down 5.0%. Together, they account for just 1.1% of the index.
The ISP is still a trial series. There is no single overall ISP number yet; MoSPI says that will come later.
Also, year-on-year growth is only available from April 2026, because there are no monthly numbers for the new base year to compare against.
It matters because services make up more than 50% of India’s economy. Until now, the main regular measure was only the quarterly GDP data.
Trade and IT make up nearly half of the new services index
How much each part of the services economy counts in MoSPI’s new Index of Services Production. Trade and IT together make up 46.1% of it.
% OF THE INDEX
- Trade23.6%
- IT and computer services22.5%
- Administrative and support14.8%
- Banking and insurance13.5%
- Other 12 sub-sectors25.6%
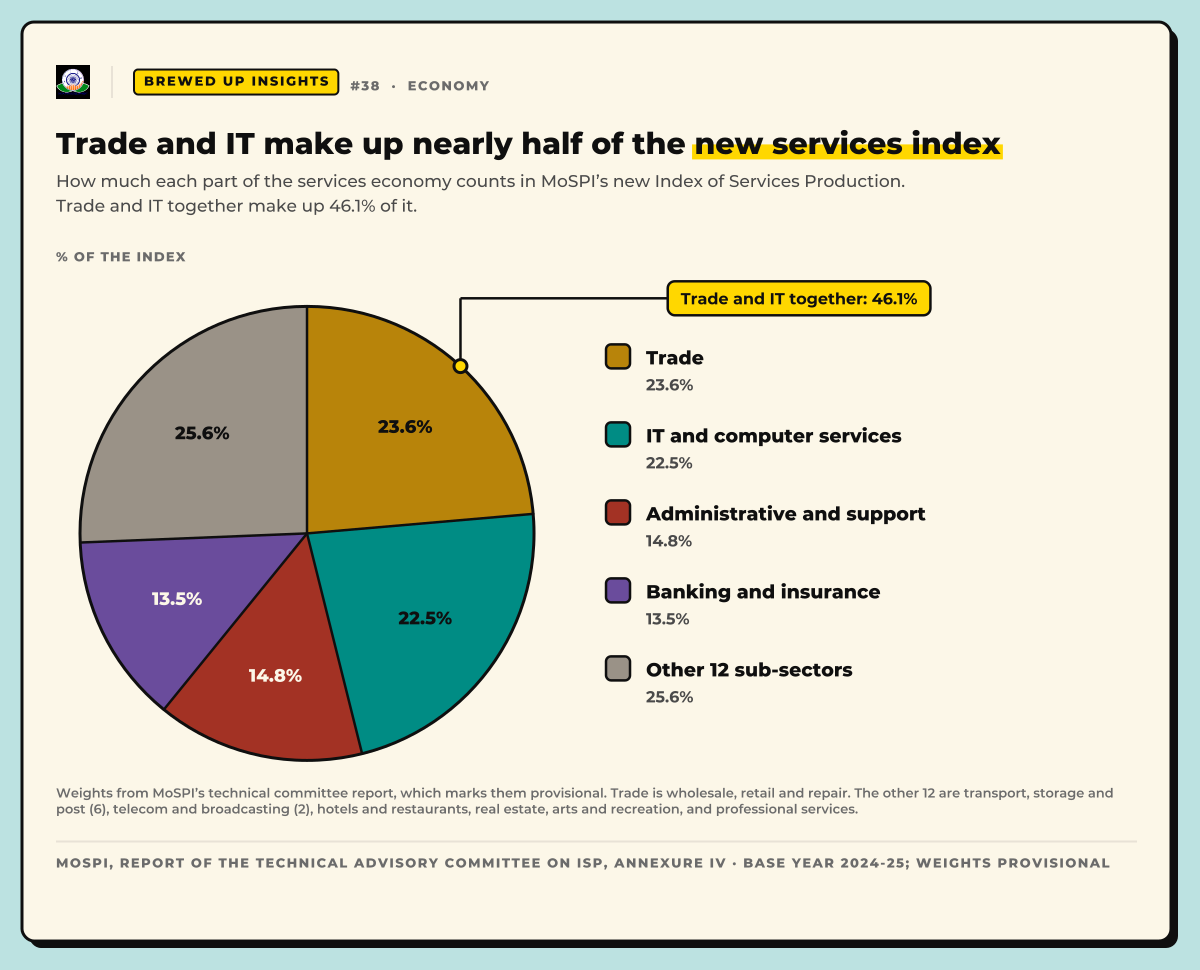
Trade and IT together: 46.1%
The weights are provisional. Trade is wholesale, retail and repair.
MoSPI, Report of the Technical Advisory Committee on ISP, Annexure IV · Base year 2024-25; weights provisional