Cost of private firms' new project plans, 2024-25 to 2025-26
Private firms filed ₹5.6 lakh crore of new project plans in 2025-26
The RBI's September 2026 Bulletin has a new read on private investment in India.
The RBI tracks investment plans through 3 channels: banks and financial institutions, overseas borrowing, and IPOs.
Together, these channels covered 1,839 projects worth ₹5.6 lakh crore in 2025-26, up from ₹5.0 lakh crore the year before.
Banks and FIs sanctioned 1,032 projects worth ₹4.4 lakh crore and agreed to fund 55% of the cost. The rest comes from promoters and other sources. Another 509 companies borrowed ₹1.0 lakh crore abroad, while 298 companies raised ₹23,809 crore through IPOs.
Most of the money is concentrated in a small number of big projects. Just 112 projects account for 68.3% of the total value sanctioned by banks and FIs. And 89.2% of the project cost is greenfield, meaning it is for new factories, power plants, roads and other new infrastructure rather than expansion of existing facilities.
Power is the biggest sector, accounting for 39.6% of total project cost. Roads and bridges account for another 8.5%. In all, infrastructure makes up 54.2% of the total. Construction follows at 11.2%, with chemicals and cement also making up significant shares.
The money is also concentrated geographically. Maharashtra accounts for 20.2% and Gujarat for 17.9%. Together, the top 6 states account for 67.1% of total project cost.
The projects are moving into execution too. Around 43.2% of the planned investment was expected to be completed in 2025-26, while another 34.5%, worth ₹1.5 lakh crore, is scheduled for 2026-27. Expected actual capex in 2025-26 rose 9.2% to ₹3.5 lakh crore.
And the pipeline for 2026-27 is already looking larger. Projects currently in the system point to ₹3.2 lakh crore of investment across the 3 channels, compared with ₹2.6 lakh crore at the same point last year.
This lines up with other investment indicators: gross fixed capital formation grew 20.4% in current prices in Q1 2026-27, compared with 5.4% a year earlier. Bank term loans also grew 15.4% in June 2026, versus 8.3% a year earlier.
Power leads private project investment at 39.6%
Where banks and FIs committed money when they sanctioned ₹4.4 lakh crore of projects in 2025-26. Power alone takes 2 in every 5 rupees; all infrastructure combined takes 54.2%.
% OF TOTAL PROJECT COST
- Power39.6%
- Roads and bridges8.5%
- Construction11.2%
- Chemicals and metals10.7%
- Other sectors30.0%
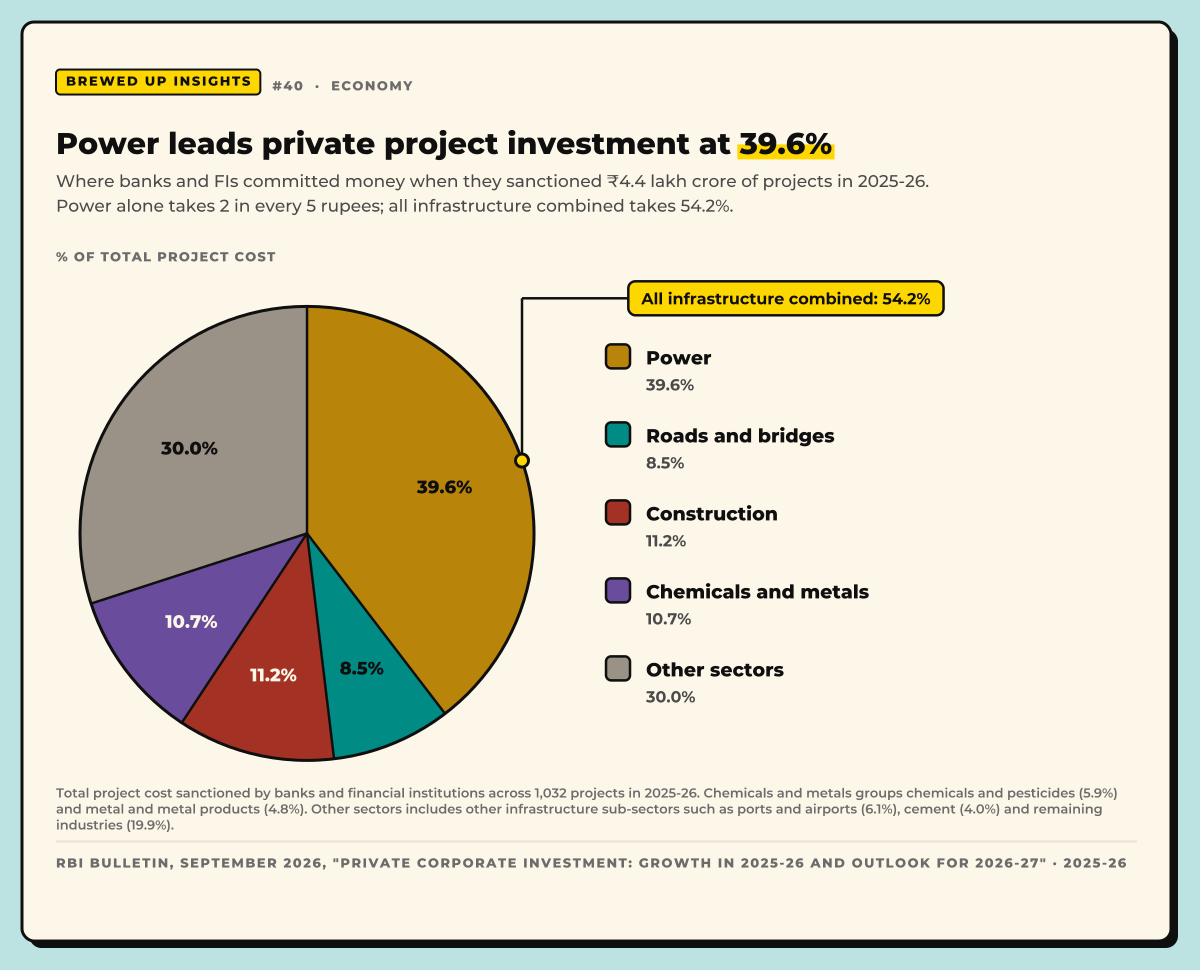
All infrastructure combined: 54.2%
Share of the cost of 1,032 projects sanctioned by banks and financial institutions in 2025-26.
RBI Bulletin, September 2026, "Private Corporate Investment: Growth in 2025-26 and Outlook for 2026-27" · 2025-26